

Introduction
Investing in property can feel like walking a tightrope. On one side, there’s the excitement of owning an asset that could grow in value. On the other, there’s the fear of hidden costs, unpredictable rent, or an investment that quietly drains your savings. It’s easy to let emotions take over-after all, who doesn’t fall for a charming house with fresh paint and a perfect backyard?
This is where numbers become your safety net. A property investing spreadsheet takes all the guesswork out of the equation. Instead of relying on gut feelings or optimistic assumptions, it lays everything out: purchase price, loan terms, expected rent, taxes, maintenance, and more. By putting these numbers in front of you, it helps prevent rushed decisions and emotional mistakes.
Table of Contents
What is a Property Investing Spreadsheet?
At first glance, a spreadsheet might just look like a grid of numbers and formulas-and honestly, that’s not far off. But a property investing spreadsheet is much more than a digital table. It’s a tool designed to give you a clear, real-world view of an investment property’s financial potential.
Think of it this way: anyone can jot down a property’s purchase price and expected rent on a piece of paper. But that’s just guessing. A proper spreadsheet organizes every number that actually affects your profit-loan payments, closing costs, taxes, insurance, maintenance, vacancy rates, and even potential rent growth. It turns a complicated, messy picture into something you can understand at a glance.
So, what separates a basic spreadsheet from a strategic one? A basic version might just subtract expenses from rent and give you a simple “profit” figure. A strategic property investing spreadsheet, on the other hand, breaks down cash flow, calculates ROI metrics like cash-on-cash return, and allows you to compare multiple properties or scenarios side by side. It’s dynamic, realistic, and built to help you make decisions with confidence instead of guesswork.
May be you like it:
Top 10 Best Trading YouTube Channels to Follow in 2025
Funding an LLC: Easy Ways to Get Startup Money
Family Wealth Strategy – Build and Protect Your Legacy
Invest Wisely: Smart Tips for Growing Your Money
Key Components of the Spreadsheet
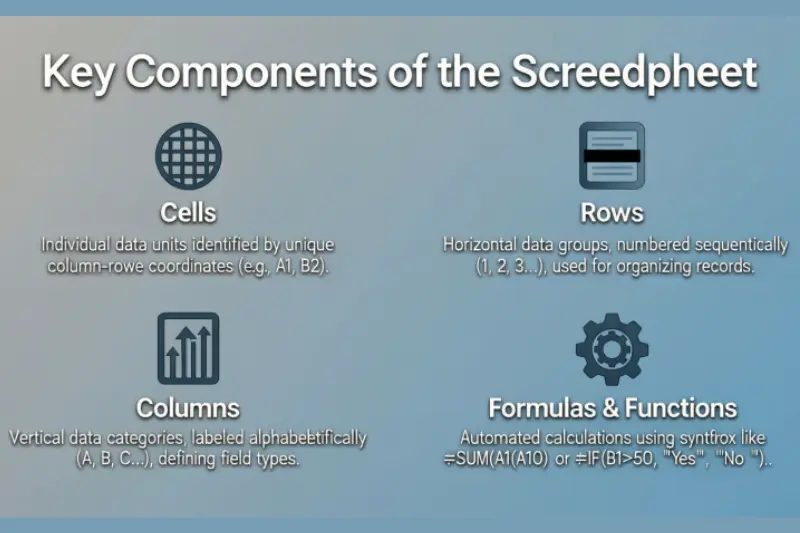
A property investing spreadsheet is only as useful as the details it captures. To make smart decisions, it needs to cover every number that can impact your return. Let’s break down the essential components you should include:
Purchase Price, Financing, and Closing Costs
The purchase price seems obvious, but don’t stop there. Your spreadsheet should also account for financing details-like your down payment, loan term, and interest rate-as well as closing costs. These numbers directly affect your monthly mortgage and long-term profitability. Even a small change in interest rate can swing your cash flow significantly, so having it all in one place keeps you in control.
Rent Assumptions
What’s your expected rental income? This might seem straightforward, but optimism can trick you. Use realistic market rents and factor in potential vacancies. Even one month without a tenant can impact your annual returns, and a spreadsheet makes that easy to calculate.
Operating Expenses
This is where the “silent profit killers” hide. Taxes, insurance, maintenance, property management fees, utilities (if you cover them), and reserves for unexpected repairs-all of these need to be included. A detailed spreadsheet helps you see how much of your income is actually profit versus necessary expenses.
Cash Flow Calculations
Cash flow is the heartbeat of any investment property. It’s what’s left over after all your expenses, including mortgage payments, are paid. A spreadsheet can automatically calculate monthly and annual cash flow, giving you a realistic picture of whether a property will put money in your pocket or drain it.
ROI Metrics
Finally, your spreadsheet should help measure returns. Metrics like cash-on-cash return, ROI, and long-term appreciation show how efficiently your invested money is working for you. Instead of guessing if a deal is “good,” these numbers give you a clear yes-or-no answer.
Cash Flow Analysis: The Monthly Reality Check
When people think about buying an investment property, the purchase price often steals the spotlight. “It’s only $250,000!” they say, or, “I can’t afford anything above $300k.” But here’s the catch: the price tag is just one piece of the puzzle. What really determines whether a property is a smart investment is cash flow-the actual money you have left in your pocket each month.
Cash flow is the difference between what you earn and what you spend. It answers the critical question: Will this property make money, or will it quietly cost me every month?
Mini Example: Calculating Monthly Profit
Let’s say you buy a small rental property:
- Monthly Rent: $1,500
- Mortgage Payment: $900
- Property Taxes: $150
- Insurance: $100
- Maintenance Reserve: $50
- Vacancy Buffer: $50
- Now, do the math:
$1,500 – ($900 + $150 + $100 + $50 + $50) = $250 cash flow per month
That $250 might not sound life-changing, but over a year, that’s $3,000 in positive cash flow. And that’s before considering potential rent increases or loan principal paydown.
A spreadsheet makes this calculation automatic and lets you adjust assumptions easily. Want to see what happens if mortgage rates rise or rent drops? Change one number, and you instantly see the impact.
Without analyzing cash flow, you might focus solely on the purchase price and end up with a property that looks cheap but actually costs you money each month. Cash flow is your reality check-it tells the true story of a property’s profitability.
ROI Metrics and Why They Matter
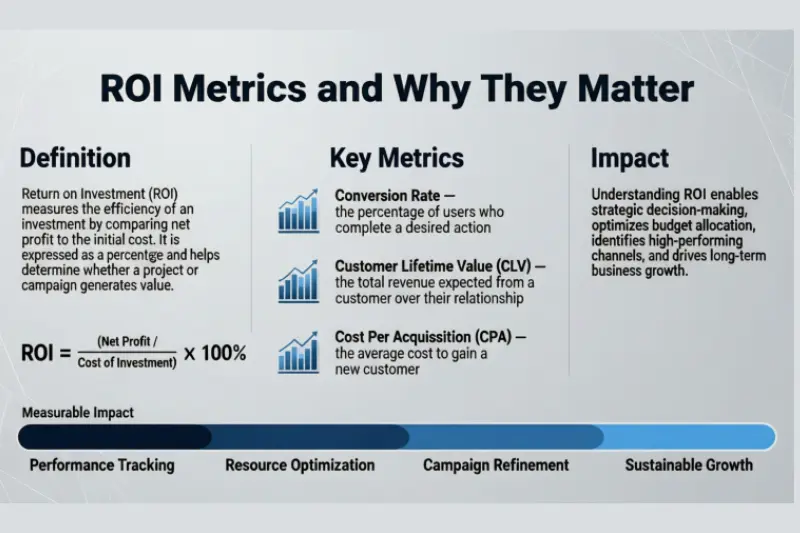
Cash flow tells you what’s happening month-to-month, but it doesn’t tell the whole story. You also want to know how efficiently your money is working for you over time. That’s where ROI-Return on Investment-metrics come in.
A property investing spreadsheet doesn’t just calculate numbers; it translates them into insights so you can make smarter choices. Let’s break down the key ROI metrics every investor should track:
Cash-on-Cash Return
Cash-on-cash return measures your annual cash flow relative to the actual cash you invested upfront. It answers the question: How much am I earning for every dollar I put in?
Mini Example:
- Cash Invested (Down Payment + Closing Costs): $50,000
- Annual Cash Flow: $6,000
Cash-on-Cash Return = $6,000 ÷ $50,000 = 12%
With a spreadsheet, you just plug in your cash invested and monthly cash flow, and it calculates this instantly-no mental gymnastics required.
Overall ROI
Overall ROI takes a bigger-picture view by including both cash flow and appreciation. It shows your total potential return over a given period.
- Annual Cash Flow + Estimated Property Value Increase ÷ Total Investment = Overall ROI
This metric is helpful if you’re thinking about holding a property for several years, not just collecting monthly rent.
Long-Term Appreciation
Even the best rental property might not feel like a win without price growth. A spreadsheet allows you to project property appreciation over time. You can test scenarios like a conservative 2% yearly increase or a more aggressive 5% and see how it impacts your total return.
Why a Spreadsheet Makes This Easier
Imagine trying to calculate these metrics in your head for three or four properties at once. You’d quickly get lost or make mistakes. A property investing spreadsheet does the math for you instantly. Change the purchase price, interest rate, or rent assumption, and all your ROI numbers update automatically.
Using Spreadsheets to Compare Multiple Properties
One of the biggest advantages of a property investing spreadsheet is its ability to turn overwhelming choices into clear decisions. Instead of guessing which property is “better,” you can actually see it in black and white.
Test Different Scenarios
With a spreadsheet, you can create a copy for each property and plug in different assumptions. For example:
- What happens if interest rates rise by 1%?
- What if a property sits vacant for two months instead of one?
- How does a higher down payment change cash-on-cash return?
By testing scenarios, you’re no longer hoping for the best-you’re preparing for the realistic range of outcomes.
Compare Neighborhoods
Two houses in different neighborhoods might have similar purchase prices, but cash flow and ROI can be dramatically different. A spreadsheet allows you to compare:
- Expected rent based on local market
- Taxes and insurance rates
- Appreciation trends
Suddenly, it’s easy to see which location gives better long-term returns.
Compare Financing Options or Property Types
Maybe one property requires a bigger down payment but offers higher rent. Another might be cheaper upfront but has higher ongoing expenses. Your spreadsheet can model both and show:
- Which option produces higher monthly cash flow
- Which option has better ROI over 5–10 years
Even more, you can compare property types-single-family homes vs. small multi-units-without needing separate complex calculations.
By putting everything in one place, your spreadsheet becomes a decision-making dashboard. You’re not guessing; you’re comparing real numbers, side by side. And that clarity can save you thousands of dollars and a lot of stress.
Common Mistakes Investors Make with Spreadsheets
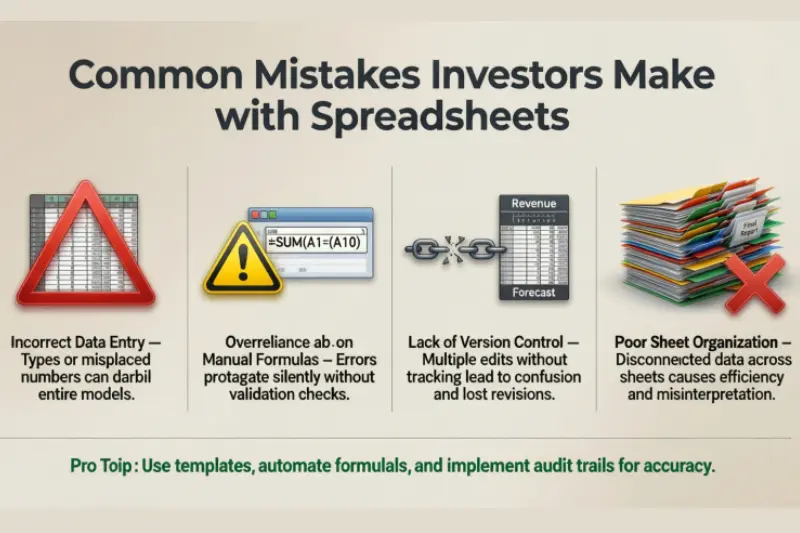
Even the best tools can backfire if they’re used the wrong way. A property investing spreadsheet is powerful-but only if you feed it honest, realistic information. Many investors make the same mistakes over and over. Let’s break down the most common pitfalls and how to avoid them.
Being Overly Optimistic
It’s easy to let hope creep into numbers. Maybe you assume 100% occupancy, zero maintenance, and rent growth every year. Sounds great on paper-but reality rarely cooperates.
Tip to avoid it:
Use conservative estimates. Factor in vacancy, repairs, and realistic rent increases. Think of it as protecting yourself, not limiting your profits.
Ignoring Expenses
Some investors focus only on the mortgage and forget about taxes, insurance, HOA fees, or property management. These “hidden” costs can quietly turn a positive cash flow into a negative one.
Tip to avoid it:
List every possible expense-even small ones like landscaping or utility reimbursements. If it affects your pocket, it belongs in your spreadsheet.
Overcomplicating Formulas
Adding 50+ formulas, conditional formatting, and nested calculations might feel impressive, but if you can’t easily understand your own spreadsheet, it’s not helping. Complexity can hide mistakes or make analysis slow.
Tip to avoid it:
Keep it simple. Use clear labels and straightforward formulas. Your goal is clarity, not spreadsheet gymnastics.
May be you like it:
Top Finance Webinars to Boost Your Money Skills
My Funding Choice: Find the Best Way to Finance Your Goals
Wealth and Success – Habits That Transform Your Future
Invest Criteria: How to Choose Smart Investments
Bonus Tip: Update Regularly
A spreadsheet is only as accurate as the numbers you put in. Market conditions, rent trends, and loan terms change. Make a habit of updating assumptions periodically.
By avoiding these mistakes, your spreadsheet becomes a reliable decision-making tool, not a source of confusion or false confidence.
Spreadsheet vs Online Calculators
When it comes to analyzing properties, you have a couple of options: use a dedicated spreadsheet or rely on online calculators. Both can be useful, but they serve very different purposes.
Online Calculators: Quick and Easy
Online tools are great for a fast snapshot. You enter the purchase price, rent, and mortgage, and they spit out estimated cash flow or ROI.
Pros:
- Quick results in seconds
- No setup required
- Easy for beginners
Cons:
- Limited customization
- Often hide assumptions or fees
- Can’t easily compare multiple scenarios side by side
Think of them as a speedometer-they give you an idea of where you are, but they don’t show the full roadmap.
Property Investing Spreadsheets: Full Control
Spreadsheets, on the other hand, put everything in your hands. You control every input: purchase price, financing terms, rent projections, expenses, vacancy, maintenance-you name it.
Why spreadsheets give better long-term value:
- You can test multiple scenarios and what-if situations
- They allow side-by-side comparisons of properties
- Formulas automatically update when you change assumptions
- They scale as your portfolio grows-one spreadsheet can track multiple properties
In short, online calculators are fine for a quick estimate, but a spreadsheet gives you real insight, flexibility, and control-the tools you need for serious property investing.
Tips for Beginners: Getting Started Without Overwhelm
If you’re new to property investing, the idea of building a spreadsheet can feel intimidating. Rows, formulas, projections-it might seem like you need a finance degree to get it right. The truth? You don’t. You just need a simple, practical approach.
Start Simple
Don’t try to capture every possible detail on day one. Begin with the basics: purchase price, mortgage, expected rent, and major expenses like taxes and insurance. Even a simple spreadsheet will give you a clearer picture than guessing or relying on gut feelings.
Use Conservative Estimates
Beginners often overestimate income and underestimate costs. Start with conservative assumptions:
- Slightly lower rent than the market average
- Factor in at least one month of vacancy per year
- Budget for maintenance and unexpected repairs
- This way, you’re planning for reality, not hope.
Evolve the Spreadsheet as You Gain Experience
Your spreadsheet isn’t static. As you invest in more properties and learn the nuances of your market, you can add sections for:
- Property management fees
- Long-term appreciation projections
- Advanced ROI metrics
Think of it like a living document that grows with your knowledge and portfolio. The more you use it, the more powerful it becomes.
Starting simple, being realistic, and improving over time will help you build confidence, avoid mistakes, and make smarter investment decisions without feeling overwhelmed.
FAQs
What is a property investing spreadsheet?
It’s a tool that organizes all financial details of an investment property—purchase price, rent, expenses, and ROI—so you can make informed decisions.
Why is cash flow more important than purchase price?
Cash flow shows the actual money left in your pocket each month, revealing if a property truly makes money instead of just looking cheap.
What key metrics should a spreadsheet track?
Cash flow, cash-on-cash return, overall ROI, operating expenses, and long-term appreciation are the main metrics to watch.
Can beginners use a property investing spreadsheet?
Yes! Start simple with realistic estimates, track basic income and expenses, and evolve your spreadsheet as you gain experience.
How does a spreadsheet compare to online calculators?
Spreadsheets offer full control, scenario testing, and side-by-side property comparisons, while online calculators are limited to quick estimates.
Conclusion:
At the end of the day, a property investing spreadsheet isn’t just about numbers-it’s about clarity, control, and confidence. It turns uncertainty into insight, helping you see the real story behind every potential investment.
When you use a spreadsheet to track purchase price, rent, expenses, cash flow, and ROI, you’re no longer relying on guesswork or gut feelings. You can compare properties side by side, test “what-if” scenarios, and make decisions based on facts instead of emotions.
Investing in real estate will always involve some risk, but the more you understand the numbers, the more comfortable you become with those risks. That’s the real power of a spreadsheet-it gives you the confidence to walk away from bad deals, negotiate smarter, and focus on properties that truly make sense for your goals.
So next time you’re eyeing a property, don’t just admire the curb appeal or dream about future rent checks. Open your spreadsheet, plug in the numbers, and let the data guide you. Because in property investing, knowledge isn’t just power-it’s profit.
May be you like it:
Best Day Trading Setup – Simple Strategies That Work
Business Finance Definition Made Easy for Understanding Info