

Introduction
If you’ve ever glanced at a trading chart and felt like you were staring at a secret code, you’re not alone. The Candlestick Trading Bible shows you how to decode these charts and turn them into actionable insights. Candlestick charts are designed to make sense of price movements at a glance, showing not just where the market is, but how it got there. Unlike line charts that simply connect closing prices or bar charts that can feel overwhelming, candlestick charts combine open, high, low, and close in a single, easy-to-read visual.
Each candle tells a story. The body shows whether buyers or sellers were in control, while the wicks hint at market testing or rejection of certain price levels. That’s why traders love them-they’re not just charts; they’re a snapshot of market psychology.
Understanding candlesticks is like learning a language. Once you follow the strategies in The Candlestick Trading Bible, you can start spotting trends, reversals, and high-probability setups faster than relying on numbers alone. And the best part? You don’t need to be a math genius-just a keen observer with a bit of practice.
Table of Contents
History of Candlestick Charts
Candlestick charts might look modern, but their roots go back centuries-to 18th century Japan. They were first used by rice traders to track the price of rice and manage risk. A Japanese rice trader named Homma is credited with developing this technique. He realized that price movements weren’t random; they reflected the emotions of market participants-fear, greed, hesitation, and confidence.
Over time, these charts evolved from a local trading tool into a global phenomenon. In the 1990s, Western traders discovered them and quickly realized their power in stocks, forex, and commodities. Today, candlestick charts are a cornerstone of technical analysis, helping traders interpret market psychology at a glance.
It’s fascinating to think that a method born in rice markets centuries ago now guides millions of trades every day. Understanding this history isn’t just trivia-it shows that candlestick patterns are tried-and-true reflections of human behavior in markets, which rarely change over time.
Why The Candlestick Trading Bible is a Must-Read
There are plenty of trading books out there, but The Candlestick Trading Bible stands out because it goes beyond theory. It’s packed with real-world examples, case studies, and actionable strategies that show you how patterns play out in live markets. Instead of vague advice, it gives you practical tools you can apply immediately.
What makes this book truly valuable is how it helps you turn knowledge into profitable trading habits. You learn to observe, analyze, and act with discipline. It teaches journaling techniques, pattern recognition strategies, and risk management tips that build confidence over time.
Even if you’ve studied candlesticks before, this book ties everything together in a way that’s easy to follow, making abstract concepts concrete. By the end, charts that once seemed intimidating start to feel intuitive. You’ll not only understand market movements-you’ll know how to respond to them strategically, giving you a real edge in trading.
May be you like it:
Top 10 Best Trading YouTube Channels to Follow in 2025
Funding an LLC: Easy Ways to Get Startup Money
Family Wealth Strategy – Build and Protect Your Legacy
Invest Wisely: Smart Tips for Growing Your Money
Understanding Candlestick Anatomy
Before you can read candlestick charts like a pro, it’s essential to understand what each candle represents. At its core, a candlestick shows four key pieces of information for a specific time period: Open, High, Low, and Close.
- Open: The price at which the asset started trading during that period.
- High: The highest price reached.
- Low: The lowest price reached.
- Close: The price at which the trading period ended.
The real body of the candle-the thick part-shows the difference between the open and close. If the close is higher than the open, the candle is usually colored green or white, indicating buying pressure. If the close is lower than the open, it’s red or black, signaling selling pressure.
Then there are the shadows, or wicks-the thin lines above and below the body. They show the extremes: the highest and lowest points reached during the period. Long wicks can indicate rejection or testing of certain price levels, while short wicks often suggest stability.
Think of each candle as a mini story: the body tells you who was in control, and the wicks reveal the struggles that occurred along the way. Once you get used to reading these stories, patterns and potential market moves become much easier to spot.
Common Candlestick Patterns
Candlestick charts are powerful because patterns emerge that hint at what traders might do next. Let’s look at some of the most common ones and what they usually signal:
Doji
A Doji forms when the open and close prices are almost the same, creating a tiny body with long wicks. It signals indecision-neither buyers nor sellers are fully in control. Spotting a Doji after a strong trend can hint at a potential reversal.
Hammer & Hanging Man
Both look like little lollipops with long lower shadows:
- Hammer: Appears at the bottom of a downtrend and suggests buyers are stepping in.
- Hanging Man: Shows up at the top of an uptrend and warns sellers might take over.
Engulfing Patterns
An engulfing candle completely “swallows” the previous candle’s body:
- Bullish Engulfing: A small red candle followed by a large green candle. Signals buyers are gaining momentum.
- Bearish Engulfing: A small green candle followed by a large red candle. Suggests sellers are taking control.
Morning Star & Evening Star
These are three-candle patterns:
- Morning Star: Appears at the bottom of a downtrend and indicates a potential bullish reversal.
- Evening Star: Appears at the top of an uptrend and signals a potential bearish reversal.
Candlestick patterns are like clues. They don’t guarantee what will happen next, but they give you an edge by showing how the market participants are behaving. Combine these patterns with trend analysis or volume, and you start to see the story the charts are telling in real time.
Reading Market Sentiment
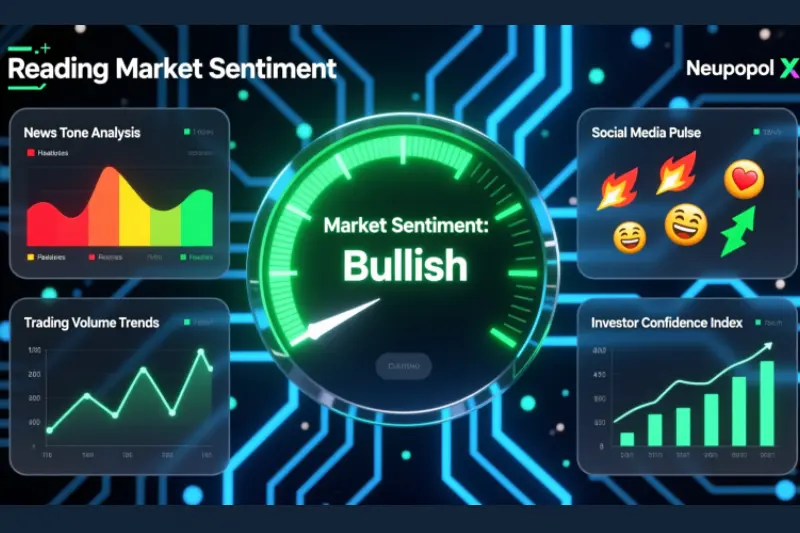
Candlestick charts do more than show price-they give you a glimpse into the mood of the market. Every candle reflects the ongoing tug-of-war between buyers and sellers, and learning to “read” these battles can give you a serious edge.
For example, a long green candle after a series of small red candles suggests buyers are stepping in aggressively. Conversely, a long red candle at the top of an uptrend signals sellers might be gaining control. By observing the size, position, and sequence of candles, you can gauge who’s winning the tug-of-war and whether the trend is likely to continue.
Candles also help anticipate reversals. Patterns like Dojis or Hammers often appear at turning points, hinting that sentiment is shifting. Think of it as eavesdropping on the market-if you notice hesitation or sudden swings, you can prepare for potential trend changes before they fully develop.
The key is context. A single candle rarely tells the full story. Look at the overall trend, volume, and nearby support or resistance levels. When all these clues line up, candlestick patterns become a powerful tool to anticipate where the market might head next.
High-Probability Trading Setups
Knowing candlestick patterns is great, but spotting setups that actually work is what separates consistent traders from beginners. High-probability setups combine patterns with the broader market context rather than relying on a single candle.
For instance, a bullish engulfing pattern is much more reliable if it appears near a strong support level during an uptrend. On the flip side, spotting the same pattern in the middle of a chaotic sideways market might lead to a false signal. That’s why trend analysis is your best friend-patterns should confirm the trend, not contradict it.
Another tip: watch for confluence. If multiple signals line up-candlestick pattern, trend direction, and technical indicators like moving averages or RSI-you’re looking at a setup with higher odds of success.
And remember, no setup is perfect. False signals happen even to the pros. That’s why risk management-like setting stop-losses and sizing trades carefully-is as important as spotting the patterns themselves. With practice, you’ll start to recognize setups that have a real edge, saving time and avoiding trades that are more likely to fail.
Integrating Candlesticks With Other Tools
Candlestick patterns are powerful on their own, but their effectiveness skyrockets when combined with other trading tools. Think of it like adding layers of clarity-each tool confirms what the candles are already hinting at.
Support and Resistance: These levels act as natural barriers. A bullish pattern forming near a strong support level is more likely to succeed, while a bearish pattern near resistance can signal a potential reversal.
Moving Averages: Trend-following indicators like the 50-day or 200-day moving averages help you identify the bigger picture. A candlestick pattern that aligns with the trend suggested by moving averages carries more weight.
RSI (Relative Strength Index): Candlestick signals paired with RSI can highlight overbought or oversold conditions. For example, a hammer appearing when RSI shows oversold conditions strengthens the case for a bullish reversal.
Volume: Volume confirms commitment. A breakout candle on high volume is much more reliable than one on thin trading activity. It shows that market participants are actually backing the move.
The key idea here is confirmation. One candle might tell a story, but multiple indicators saying the same thing dramatically improves your odds. Think of it as cross-checking your sources-when several clues align, you’re more likely to make a smart trading decision.
May be you like it:
Top Finance Webinars to Boost Your Money Skills
My Funding Choice: Find the Best Way to Finance Your Goals
Wealth and Success – Habits That Transform Your Future
Invest Criteria: How to Choose Smart Investments
Common Mistakes to Avoid
Even the best traders stumble if they fall into common traps. When it comes to candlestick trading, a few mistakes can cost more than just a trade-they can shake your confidence.
Misreading Patterns:
Not all patterns signal what they seem at first glance. For example, a hammer at the top of an uptrend doesn’t mean the market will rise-it might actually warn of a reversal. Context is everything. Always consider the trend, support and resistance levels, and the surrounding candles before acting.
Overtrading Based on a Single Candle:
It’s tempting to jump in every time you spot a bullish or bearish candle, but doing so can quickly drain your account. One candle is rarely the whole story. High-probability setups usually involve multiple signals confirming each other, not just a lone pattern.
Ignoring Risk Management:
Even the most reliable setups can fail. Always use stop-losses and position sizing to protect yourself.
By avoiding these mistakes, you’ll save yourself from unnecessary losses and start trading more confidently. Remember, trading is a marathon, not a sprint-consistency matters more than chasing every candle.
Practical Trading Tips & Exercises
Learning candlestick patterns is one thing-applying them consistently is another. Here are some practical ways to turn knowledge into real trading skills:
Journaling Your Trades:
Keep a simple trading journal. Note down the pattern you spotted, the market context, your entry and exit points, and the outcome. Over time, you’ll start seeing which patterns work best for you and which setups are more reliable. It’s like creating your own personalized playbook.
Observing Patterns in Live Charts:
Spend time watching live charts, even if you’re not trading with real money yet. Look for repeating patterns, test your predictions, and see how the market reacts. This builds intuition, so when a high-probability setup appears, you’ll recognize it immediately.
Combine Study With Practice:
Try paper trading or demo accounts to practice without risking money. The more you observe, the faster you’ll understand nuances like wicks, trend strength, and volume confirmation.
Reflect and Adjust:
After each session, review your trades. Ask yourself: Did I follow my plan? Did I misread a candle? Could I improve my timing? This reflection is crucial for turning experience into expertise.
Candlestick mastery isn’t about memorizing patterns-it’s about developing an eye for market behavior, understanding context, and making disciplined decisions. These exercises are small steps that compound into real trading confidence.
FAQs
What is The Candlestick Trading Bible?
It’s a comprehensive guide that teaches traders how to read candlestick charts, understand market psychology, and identify profitable trading opportunities.
Why are candlestick patterns important in trading?
Candlestick patterns reveal buyer and seller strength, potential reversals, and trend momentum, giving traders an edge in decision-making.
Can beginners benefit from this book?
Absolutely. It explains patterns, setups, and strategies in a simple, step-by-step way, making it easy for beginners to start trading confidently.
How does the book improve trading accuracy?
It combines real-world examples, case studies, and actionable exercises that teach readers to confirm patterns, avoid false signals, and apply risk management.
Is it useful for all types of markets?
Yes. The principles apply to stocks, forex, crypto, and commodities, helping traders interpret charts across different markets effectively.
Conclusion
Mastering candlestick charts isn’t about memorizing patterns or chasing every signal-it’s about understanding the story each candle tells and using that insight to make smarter trading decisions. The Candlestick Trading Bible equips you with the knowledge, examples, and strategies to read the market confidently and act with discipline.
By practicing high-probability setups, combining patterns with other tools, and reflecting on your trades, you can turn what seems like random price movement into actionable opportunities. Every candle is a clue, and with the right approach, you’ll start connecting those clues into a clear picture of market behavior.
So, whether you’re a beginner trying to make sense of charts or an experienced trader looking to sharpen your skills, this book can help you turn knowledge into real, profitable habits. The market doesn’t have to feel mysterious-it just needs a trained eye and the right strategies.
May be you like it:
Best Day Trading Setup – Simple Strategies That Work
Business Finance Definition Made Easy for Understanding Info